Input processing
224 × 224 resize, circular sky-dome mask, ImageNet normalization.
Accepted at MERCon 2026
One forecasting scaffold. Eighteen visual encoders. A controlled comparison of CNNs, Transformers, and visual state-space models under strict chronological evaluation.
University of Peradeniya · Multidisciplinary AI Research Centre (MARC)
Abstract
We isolate the visual backbone inside a fixed multimodal pipeline for 10-minute-ahead irradiance forecasting. ConvNeXt, Swin, VMamba, Spatial Mamba, and MambaVision models share identical preprocessing, temporal context, fusion, training, and evaluation. The comparison spans Folsom and a deliberately strict, low-sample NREL test split.
The results resist a simple architecture-family ranking. VMamba Small leads Folsom with 65.39 W/m² RMSE, narrowly ahead of Swin Base at 65.50 W/m². On NREL, smart persistence remains strongest at 17.48 W/m², exposing the limits of cross-regime conclusions from small chronological test sets.
Benchmark design
The visual family and scale are the only experimental variables. Every encoder is evaluated inside the same forecasting contract.
ConvNeXt T/S/B/L · Swin T/S/B · VMamba T/S/B · Spatial Mamba T/S/B · MambaVision T/T2/S/B/L
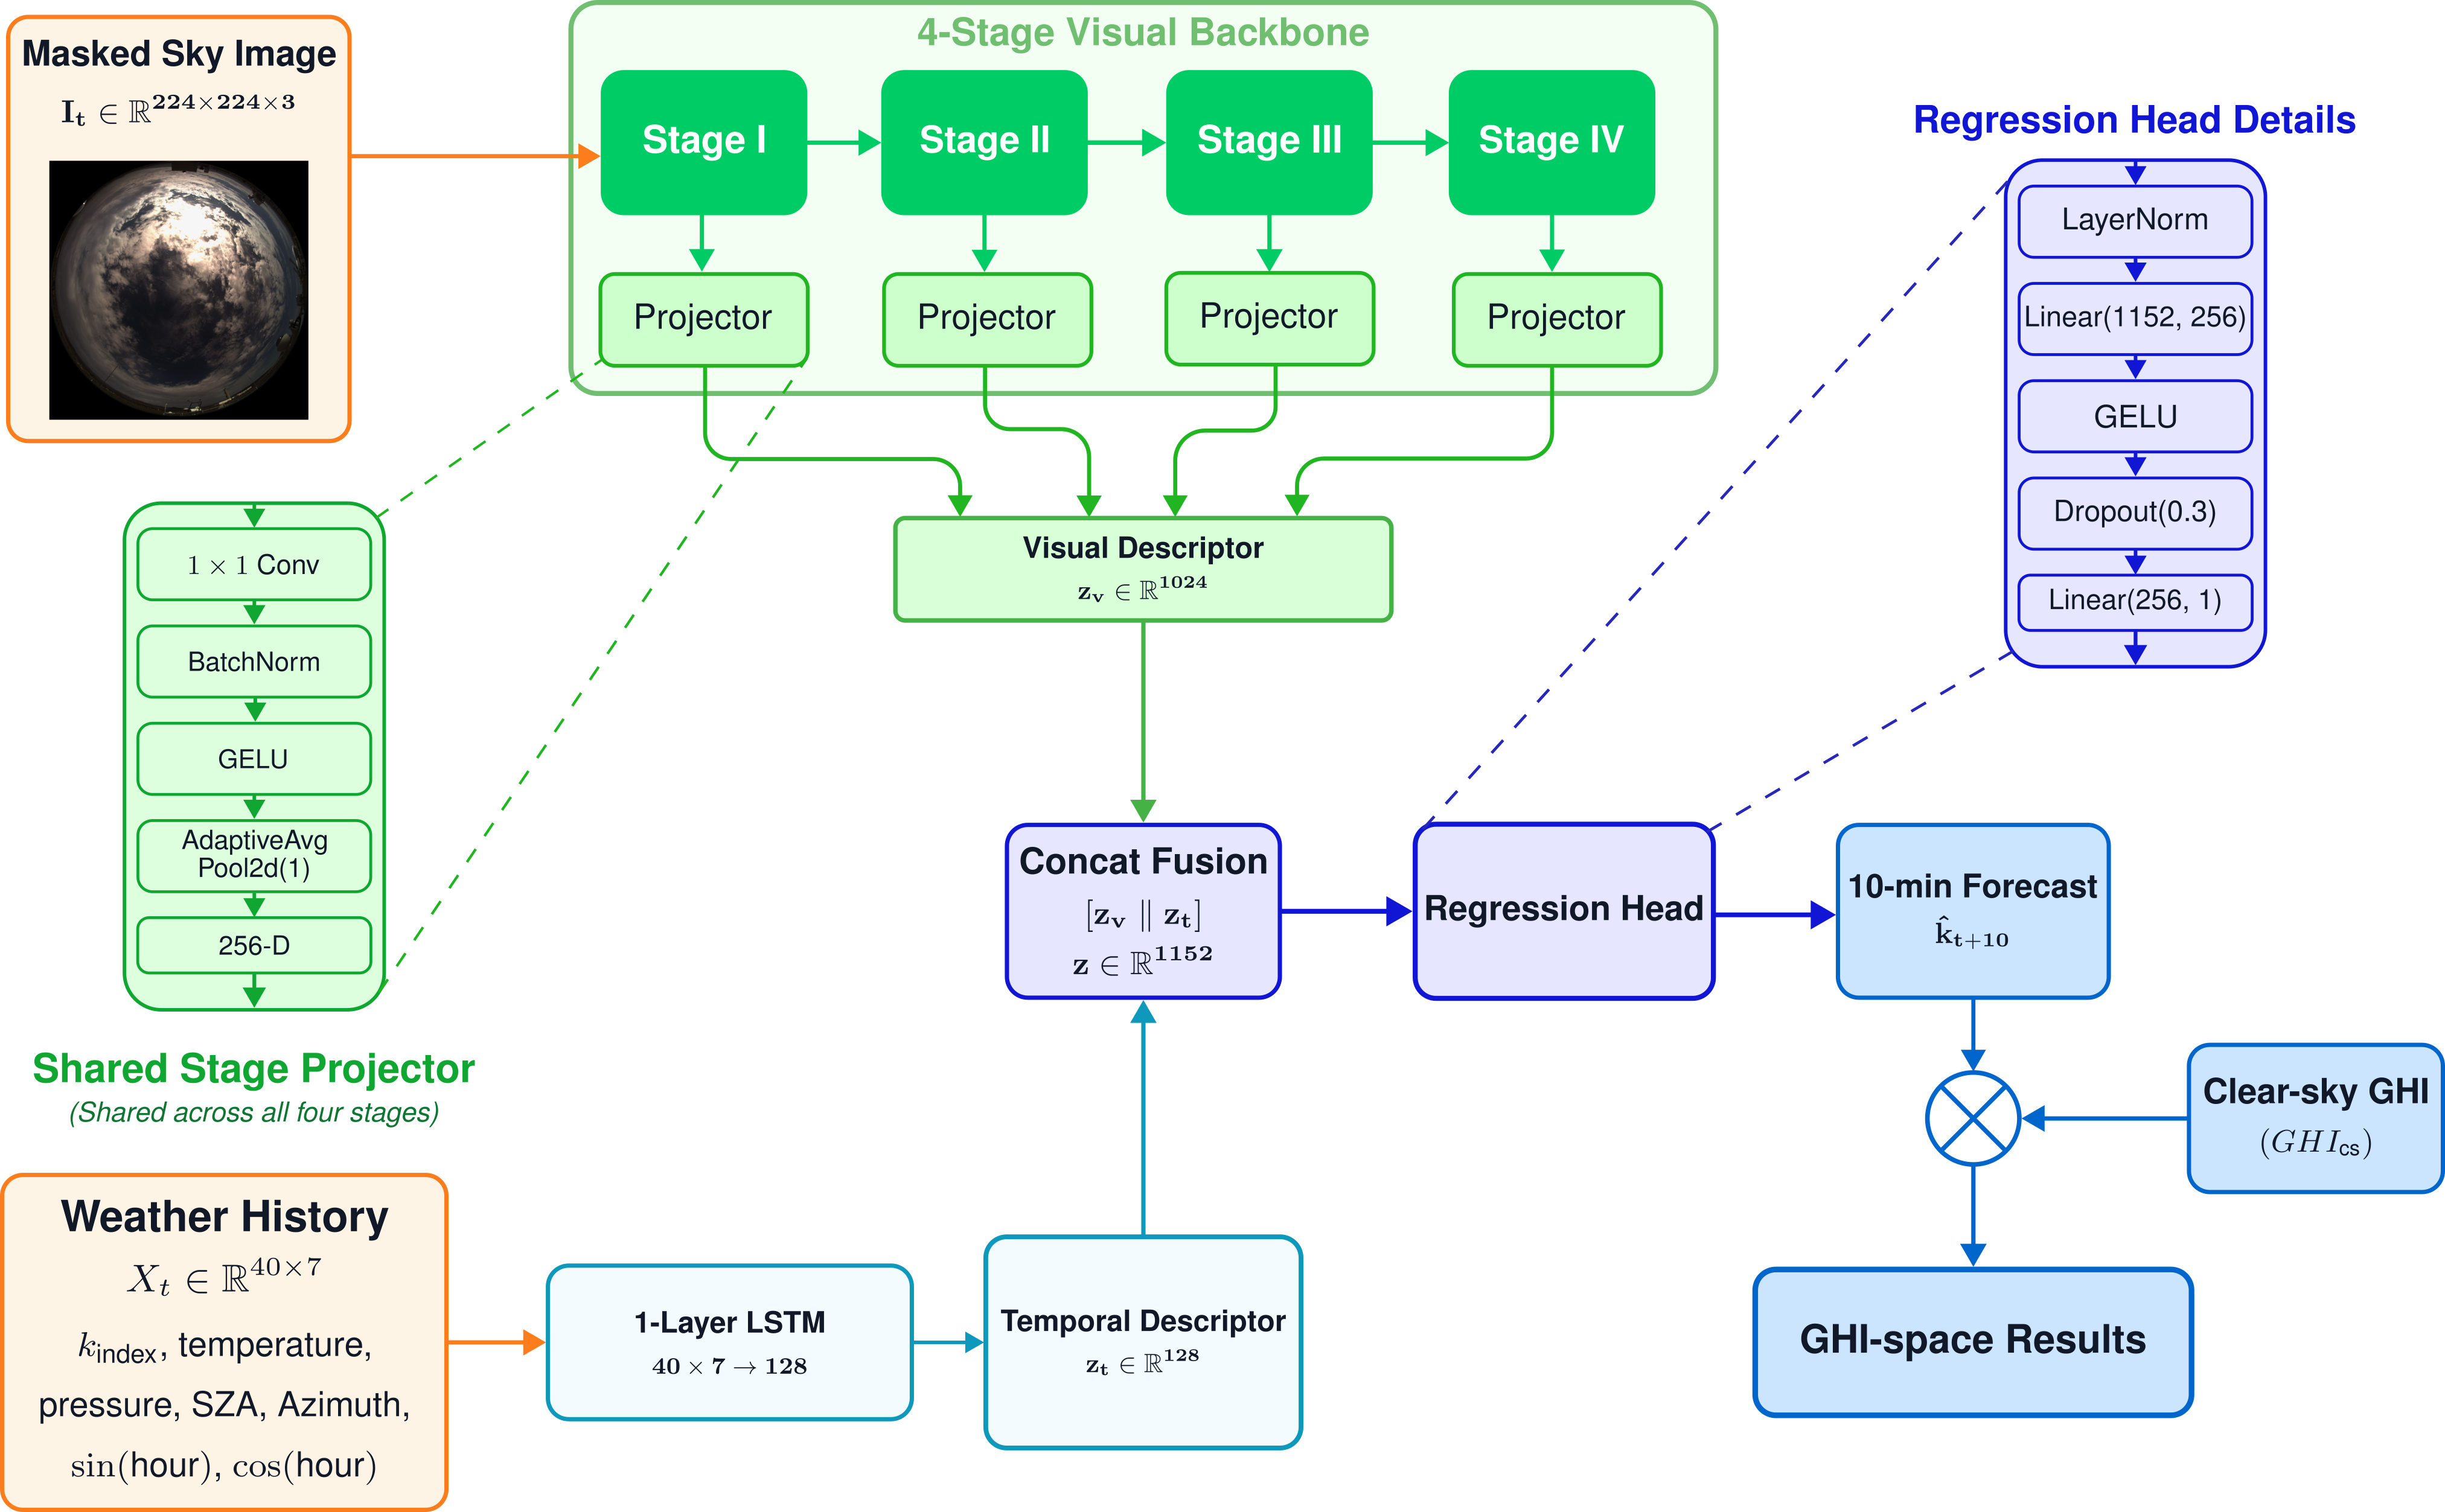
224 × 224 resize, circular sky-dome mask, ImageNet normalization.
10-minute-ahead clear-sky index, inverse-transformed to physical GHI units.
Matched image, 40-step weather history, future target, daylight and low-sun filtering.
Seven weather-history channels, single-layer LSTM, 128-D descriptor.
Four stages, fixed-form projectors, 256 channels per stage, 1024-D descriptor.
Concatenation, layer normalization, 256-unit GELU, dropout 0.3, linear output.
Huber loss, AdamW, batch size 32, 8 epochs, seed 42, cosine schedule, no early stopping.
Chronological split, smart-persistence skill, RMSE, MAE, MBE, R², parameters, FLOPs, FPS, and ERF.
Shared scaffold
Each of the four visual stages is projected to 256 dimensions and pooled. The resulting 1024-D descriptor is fused with a 128-D LSTM state.
Headline results
Lower RMSE is better. Forecast skill is measured relative to smart persistence.
Best visual · Folsom
65.39RMSE W/m²Runner-up · Folsom
65.50RMSE W/m²Best overall · NREL
17.48RMSE W/m²Folsom trade-off
Exact coordinates from the camera-ready LaTeX figure. Move over a point for its model, FPS, and RMSE.
| Backbone | Scale | Params | GFLOPs | FPS | RMSE | FS (%) |
|---|---|---|---|---|---|---|
| Smart persistence | Baseline | — | — | — | 81.37 | 0.00 |
| Temporal-only | Baseline | 0.4M | 0.0 | 13708.6 | 69.51 | 14.57 |
| ConvNeXt | T | 28.6M | 18.5 | 561.5 | 66.25 | 18.58 |
| ConvNeXt | S | 50.2M | 35.4 | 338.7 | 66.49 | 18.28 |
| ConvNeXt | B | 88.4M | 62.3 | 220.9 | 66.85 | 17.84 |
| ConvNeXt | L | 197.3M | 138.8 | 125.3 | 67.03 | 17.62 |
| Swin | T | 28.3M | 18.6 | 471.5 | 66.45 | 18.33 |
| Swin | S | 49.6M | 35.7 | 258.7 | 66.52 | 18.25 |
| Swin | B | 87.6M | 62.7 | 195.5 | 65.50 | 19.50 |
| VMamba | T | 30.2M | 20.0 | 222.9 | 66.91 | 17.76 |
| VMamba | S | 50.1M | 34.8 | 168.5 | 65.39 | 19.64 |
| VMamba | B | 88.4M | 61.3 | 135.9 | 66.21 | 18.63 |
| Spatial Mamba | T | 26.9M | 17.7 | 187.5 | 68.07 | 16.34 |
| Spatial Mamba | S | 43.2M | 28.0 | 89.3 | 65.99 | 18.89 |
| Spatial Mamba | B | 95.7M | 62.2 | 39.6 | 66.39 | 18.41 |
| MambaVision | T | 32.6M | 18.1 | 420.3 | 67.26 | 17.33 |
| MambaVision | T2 | 35.9M | 20.7 | 236.3 | 66.04 | 18.83 |
| MambaVision | S | 51.1M | 30.3 | 395.8 | 67.91 | 16.54 |
| MambaVision | B | 98.8M | 60.3 | 256.5 | 66.48 | 18.30 |
| MambaVision | L | 229.4M | 140.1 | 127.8 | 66.56 | 18.19 |
Efficiency measured with batch size 4 on an NVIDIA Quadro GV100. Smart persistence RMSE: Folsom 81.37 W/m²; NREL 17.48 W/m².
Secondary metrics
| Site | Model | RMSE | MAE | MBE | R² |
|---|---|---|---|---|---|
| Folsom | VMamba S | 65.39 | 31.61 | −3.38 | 0.9456 |
| Folsom | Swin B | 65.50 | 30.36 | −2.10 | 0.9454 |
| Folsom | ConvNeXt T | 66.25 | 31.46 | 2.74 | 0.9441 |
| NREL | Temporal-only | 21.33 | 12.76 | −3.72 | 0.2501 |
| NREL | Swin T | 23.76 | 16.40 | −4.89 | 0.0690 |
| NREL | MambaVision L | 28.91 | 22.30 | 4.11 | −0.3775 |
Reproducibility
All reported encoders use one fixed PyTorch training and evaluation protocol. Splits are chronological; no test sample crosses a temporal boundary.
| Optimizer | AdamW | Batch size | 32 |
|---|---|---|---|
| Learning rate | 5 × 10⁻⁵ | Backbone LR | 0.1 × task LR |
| Weight decay | 0.05 | Schedule | Cosine, minimum 10⁻⁶ |
| Training | 8 epochs, seed 42 | Early stopping | Disabled |
| Objective | Huber loss, δ = 1.0 | Target | 10-minute clear-sky index |
| Image input | 224 × 224 masked RGB | Weather input | 40 timesteps × 7 features |
| Efficiency hardware | NVIDIA Quadro GV100, 32 GB | Efficiency batch | 4 |
| Timing protocol | 10 warmup + 50 timed | Metrics | RMSE, nRMSE, MAE, MBE, R², FS, FPS |
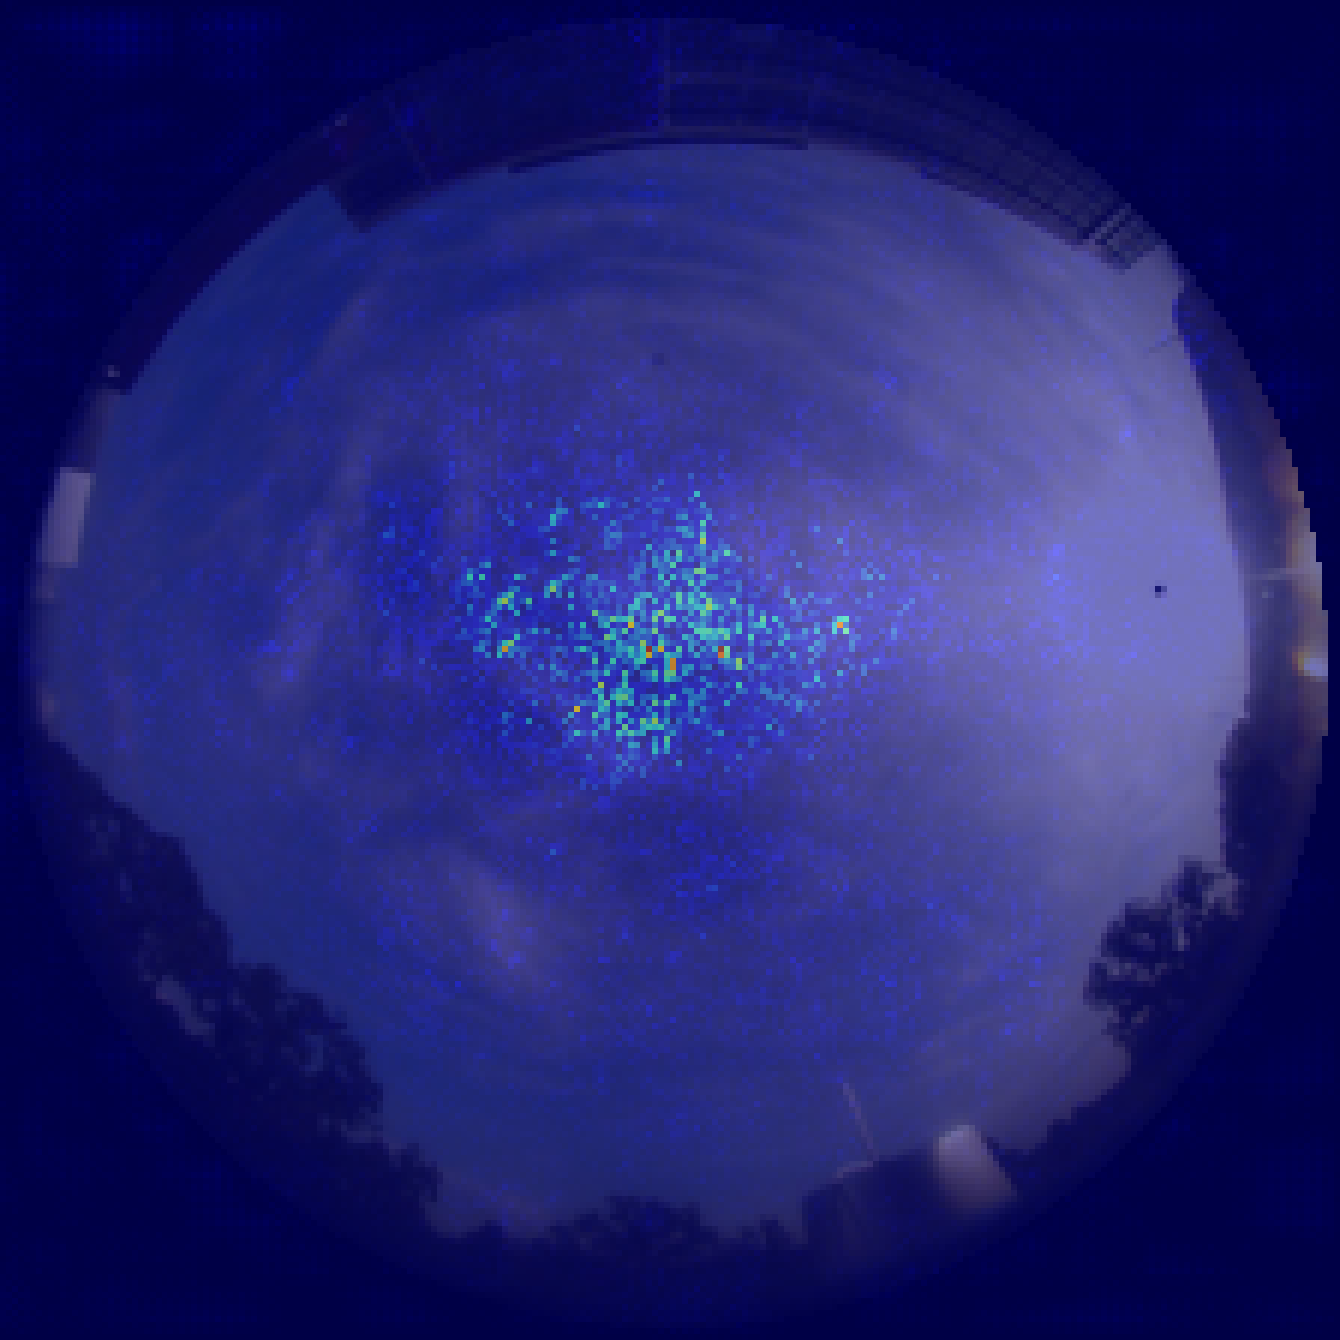
Effective receptive field
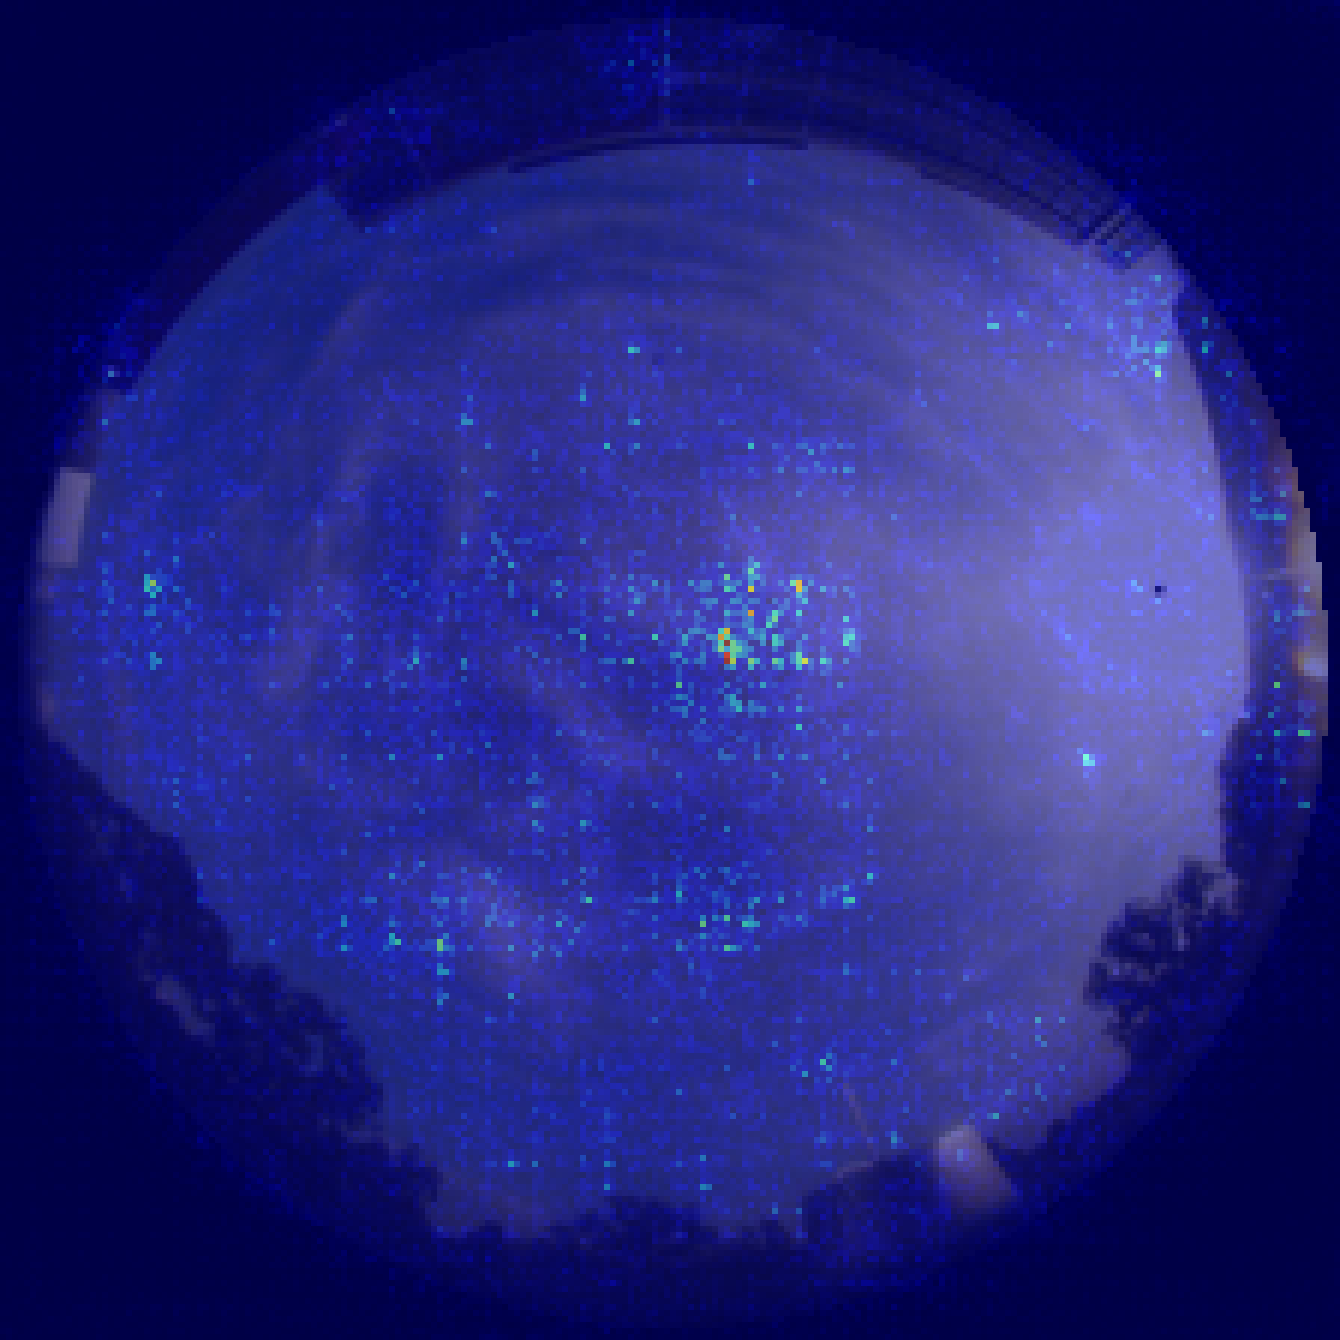
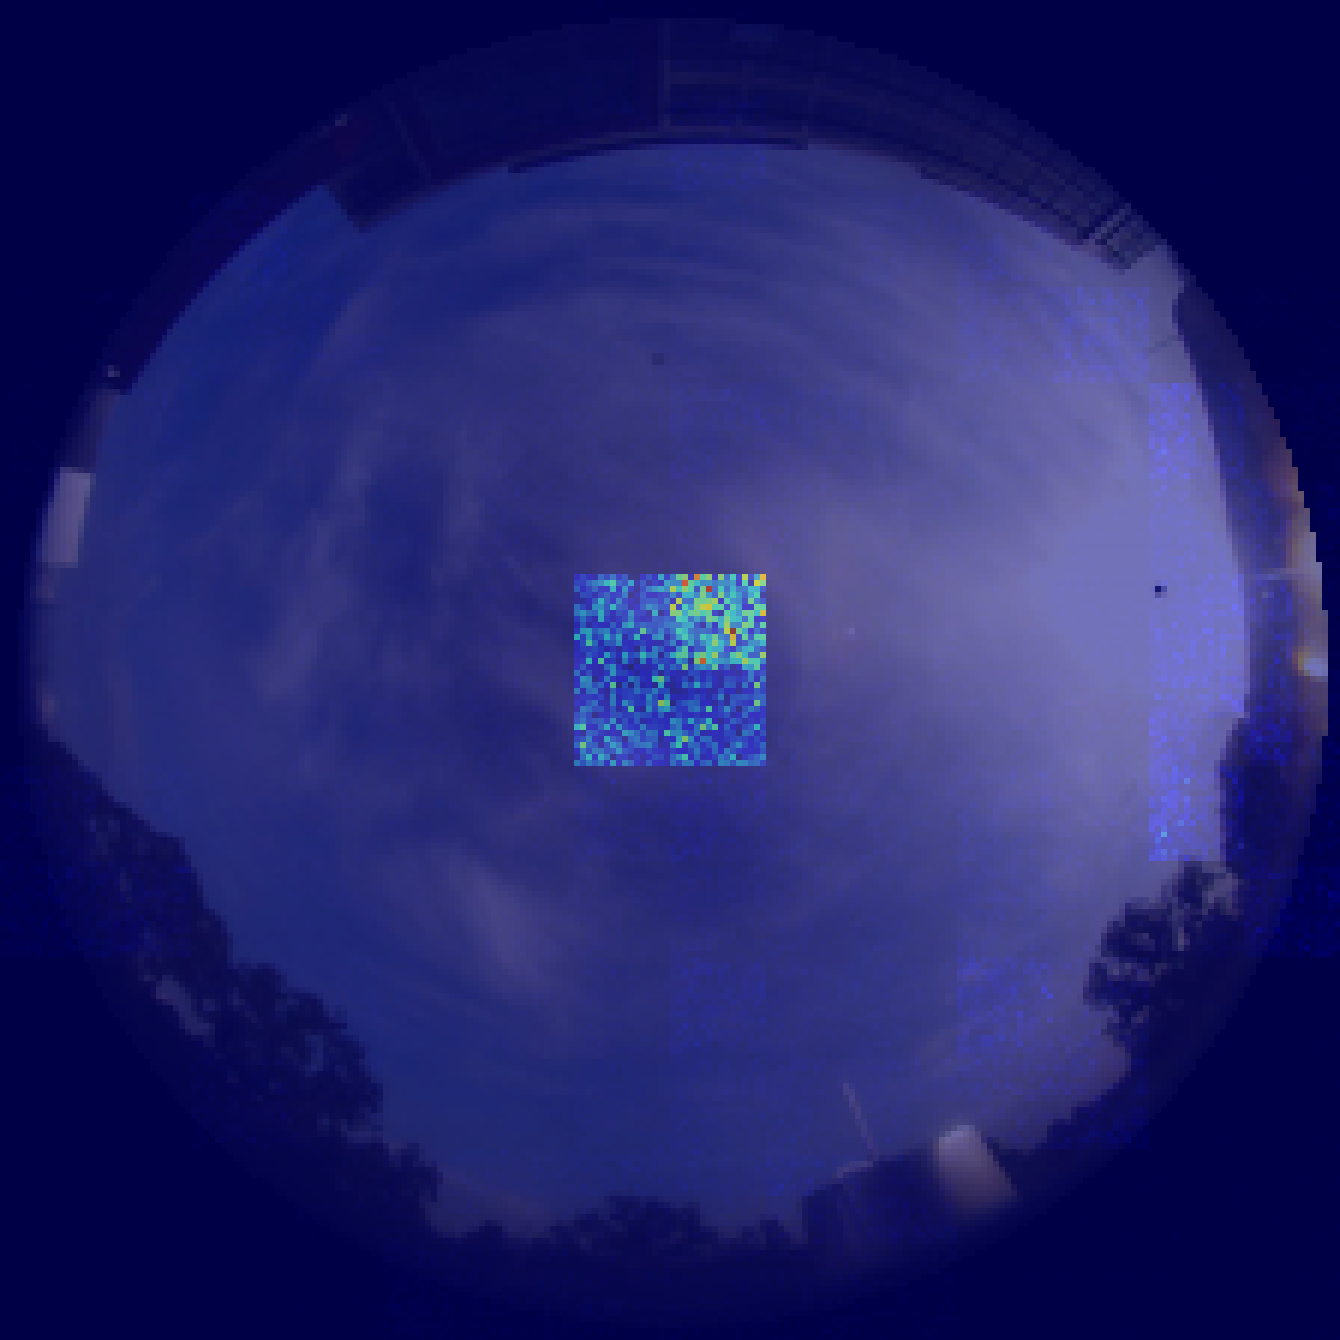
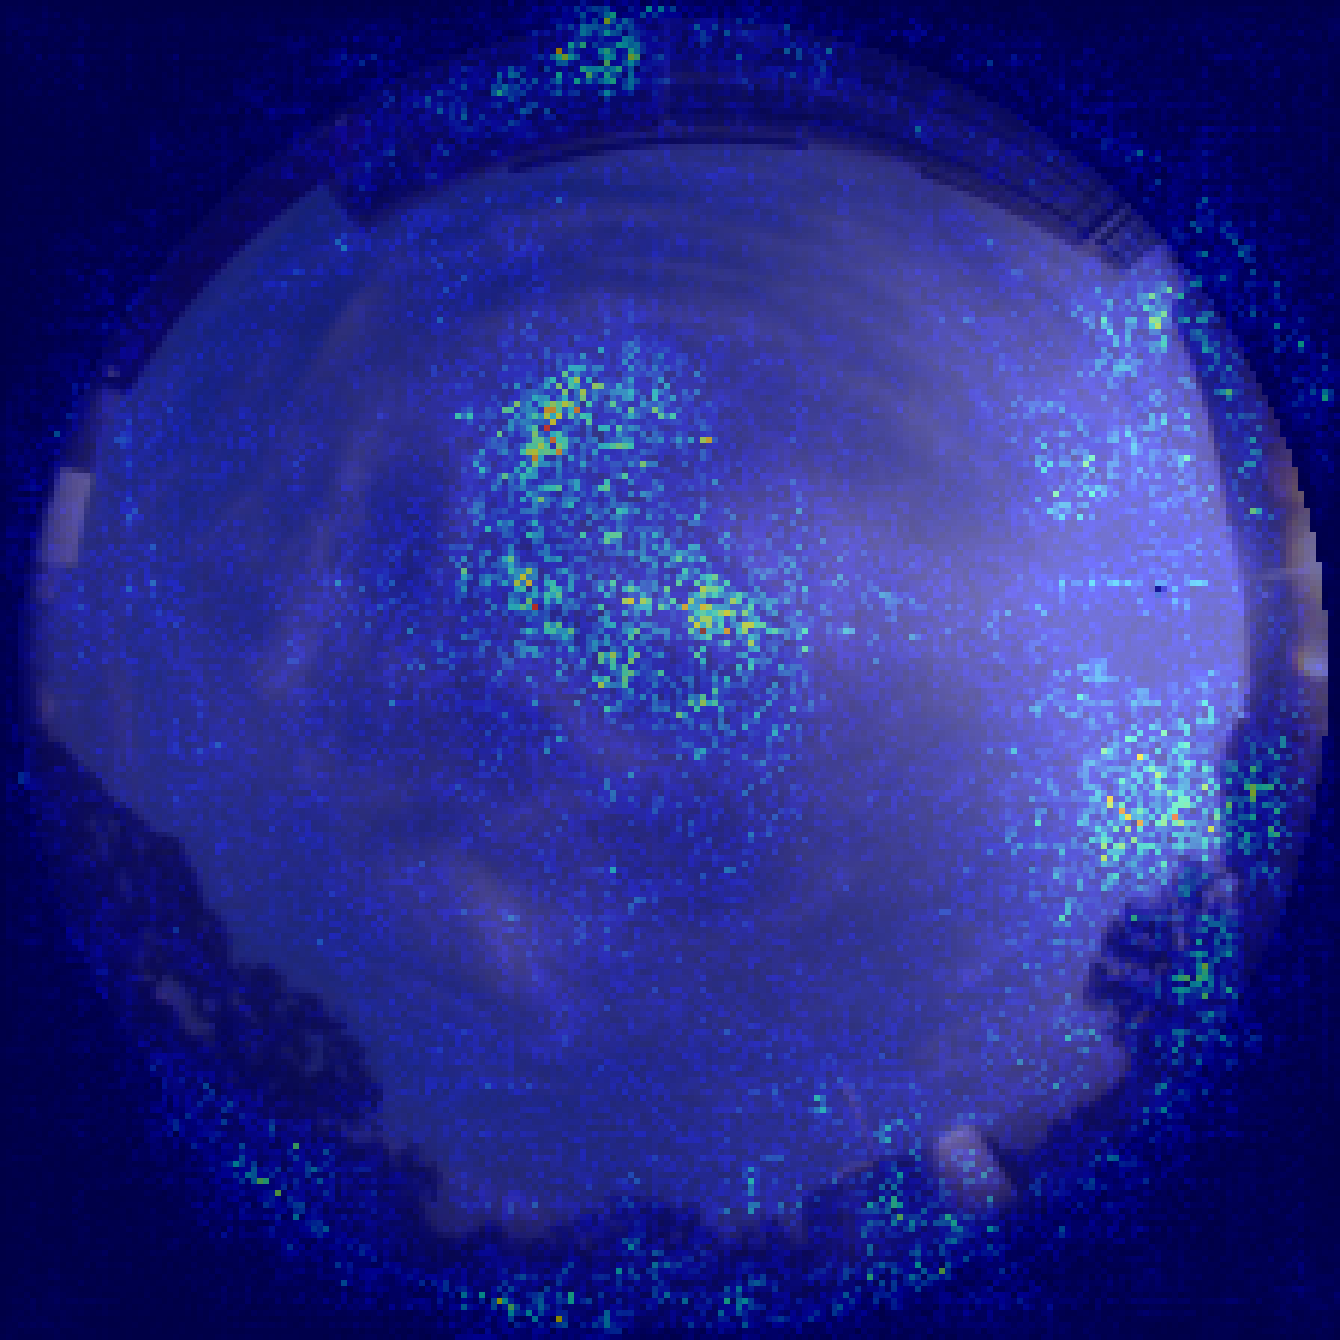
Input-gradient ERF maps reveal distinct spatial support despite the shared forecast head and training protocol.
Citation
@misc{samarakoon2026controlledvisualbackbonebenchmarkmultimodal,
  title         = {A Controlled Visual-Backbone Benchmark for Multimodal Short-Term Solar Irradiance Forecasting},
  author        = {Oshadha Samarakoon and Dushan Herath and Ishara Ranmandala and Dilshara Herath and Roshan Godaliyadda and Parakrama Ekanayake and Vijitha Herath},
  year          = {2026},
  eprint        = {2607.23633},
  archivePrefix = {arXiv},
  primaryClass  = {eess.IV},
  url           = {https://arxiv.org/abs/2607.23633}
}